Computational Tools
Methodology
The aerodynamic performance of sails, subjected to varying wind angles, was analyzed utilizing ANSYS Fluent, which provides a robust platform for computational fluid dynamics simulations. The continuity equation (equation 2) was employed as a fundamental starting point to ensure mass conservation within the system, a prerequisite for accurate fluid flow modeling.
Following the application of the continuity equation, the simulation relied upon the Navier-Stokes equations (equation 3) to describe the behavior of fluid motion. To manage the computational complexity associated with turbulent flows, the Reynolds-Averaged Navier-Stokes (RANS) equations were used. This approach simplifies the Navier-Stokes equations by averaging out the turbulent fluctuations, thereby facilitating a more efficient computation while still capturing essential flow characteristics [6]. The Spalart-Allmaras turbulence model was selected for its effectiveness in modeling the aerodynamic flow over sail surfaces. This model, which operates on a single transport equation for eddy viscosity, is particularly adept at predicting flows with adverse pressure gradients that are typical in sailing scenarios [7].
In the analysis of aerodynamic forces, the coefficients of lift (equation 4) and drag (equation 5) were of particular interest. In these simulations, the characteristic length unit (A), typically the chord length of an airfoil, was used as the reference dimension for these coefficients. By integrating these computational methods and governing equations, the simulations aimed to delineate the fluid dynamics principles that dictate sail performance. This approach is designed to yield insights that are critical for the optimization of sail configurations, enhancing an understanding of sailing efficiency from an aerodynamic perspective.
Sail Geometry
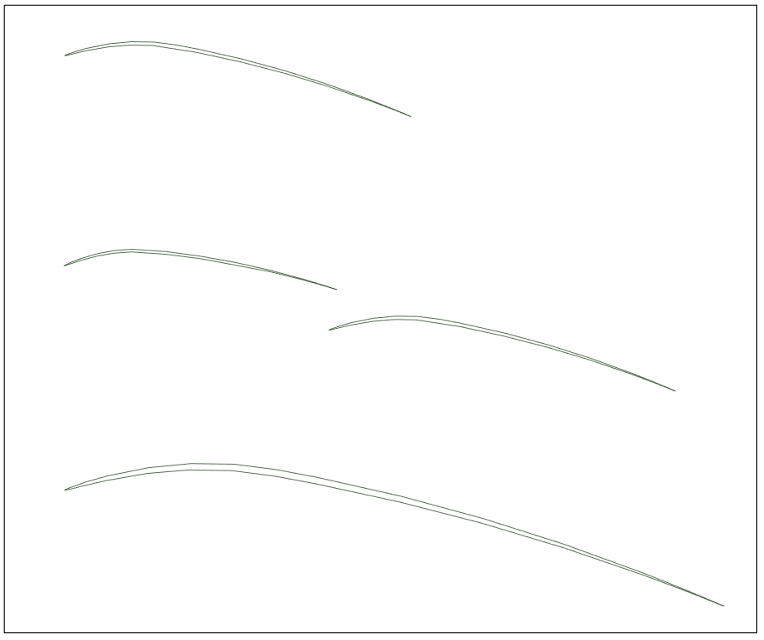
The methodology employed in this investigation entailed a series of three simulations, each designed to incrementally build upon the understanding of sail dynamics. The simulations were structured to first establish a baseline using the main-sail, then explore the aerodynamic interaction between the main-sail and foresail (jib), and finally, to compare these findings against the performance of a hypothetical, larger main-sail that embodies the combined area of the two-sail configuration. This progressive approach allows for a comprehensive examination of sail performance under varied conditions. Figure 6 illustrates the sail geometries used for each of these simulations from top to bottom respectively.
Figure 7: J/105 Sailboat [8]
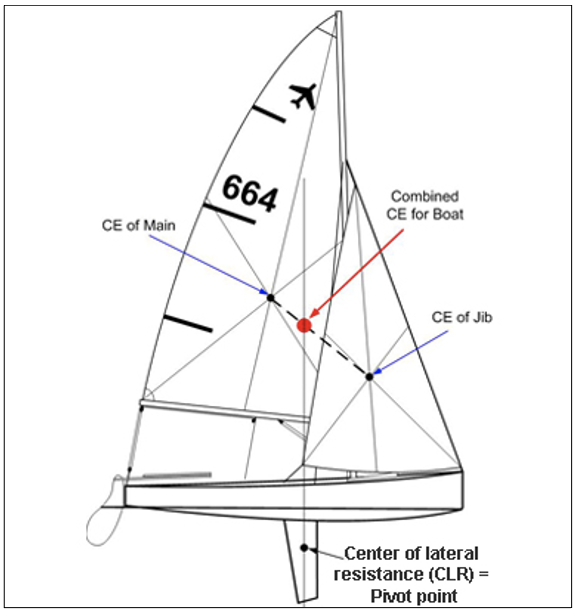
To provide a concrete basis for these simulations, the geometry was derived from the J/105 class sailboat (Figure 7). The choice of this model is rooted in its representativeness of performance-oriented sailing vessels and personal familiarity due to regular competitive racing. In seeking a precise and meaningful analysis, the concept of the center of effort (CE) is pivotal. The CE is a critical aerodynamic point on the sail, described as the locus of the cumulative aerodynamic force acting on the sail, typically assumed to be the sail's geometric center of area [9]. For the main-sail, its position is relatively straightforward to ascertain, as the center of area for a triangular shape lies at one-third the height from the base. For a two-sail configuration as shown in Figure 8, the position of the CE is determined by first locating the geometric centers of the individual sails and then dividing the line joining these centers proportionally to the sail areas, thereby locating the common CE. It is around this central point of effort that the cross-sections for the simulations were selected, ensuring that the simulations reflect a realistic and operative segment of the sails. This selection is integral, as it reflects the real-world conditions and constraints that sailors navigate when tuning sails for optimal performance.
Simplifications and Assumptions
At these slip boundaries, the fluid is permitted to move freely along the wall but cannot cross it, effectively creating a frictionless scenario. This assumption is key for a constrained yet unbounded representation of the open atmosphere in a two-dimensional analysis. On the surface of the sails, a no-slip condition was applied, reflecting the reality that fluid viscosity would bring the flow to a halt upon contact, adhering to the surface due to the fluid's inherent stickiness.
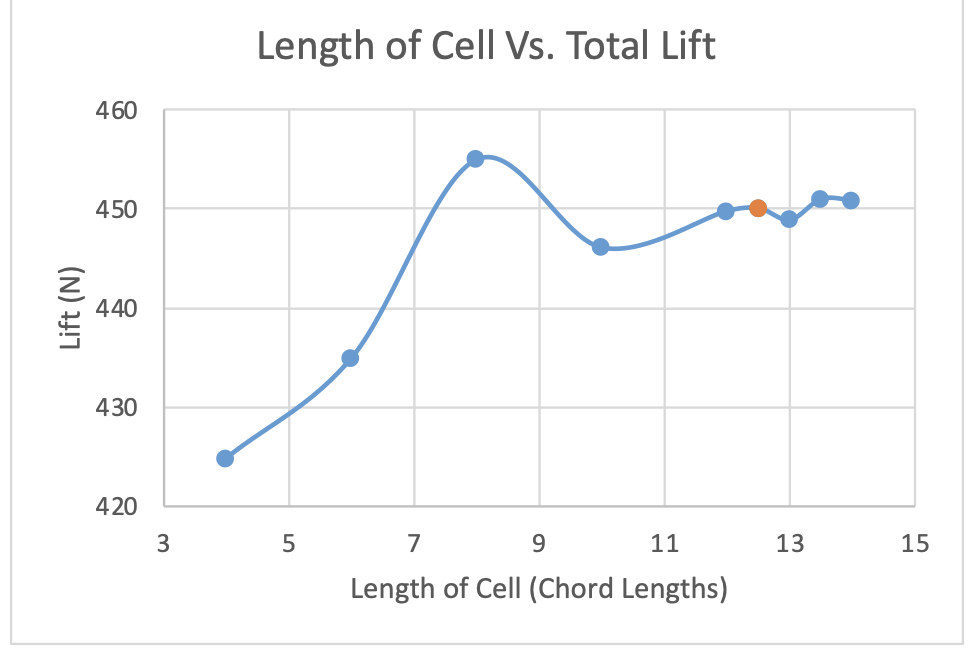
Considering these defined conditions, a parametric study was then conducted to incrementally expand the domain and ascertain the convergence of results with respect to the simulation space (Figures 14 and 15). Ultimately, the domain was set to a total length of 66 meters (12.5 chord lengths) and a total height of 31.68 meters (6 chord lengths). This configuration guarantees that the flow field around the sails is accurately captured, reflecting the true aerodynamic behavior while also avoiding unnecessary computational expense.
By adhering to this convergence strategy, the simulations were fine-tuned to provide a faithful representation of sail performance, laying a solid foundation for the subsequent analysis of aerodynamic interactions and sail efficiency within the simulated environment.
Figure 8: Center of Effort Description [10]
To render the complexity of real-world sailing into a tractable computational study, several simplifications were necessary. The decision to use a 2D cross-section instead of a full three-dimensional model significantly reduced the computational demands and focused the study on the aerodynamic interactions of the sail's surface. While this simplification omits the effects of three-dimensional flow around the sail and mast, it allows for a clearer analysis of the lift and drag forces that are central to sail performance.
The exclusion of mast geometry from the simulations also streamlines the analysis, although it neglects the influence of the mast on airflow disruption and interaction with the sail. This assumption is acceptable within the scope of this study, which primarily aims to explore the aerodynamic effects of sail interaction and angle of attack.
In the interest of exploring how sail configurations and trim affect overall boat performance, the mainsail was aligned with the boat's centerline. This strategic simplification allows us to make assertive statements regarding the efficiency of different sailing headings. By keeping the sails aligned to the centerline, we could consistently simulate how each heading impacts sail performance, isolating the effect of angle of attack from other sailing dynamics. In a real-world setting, sails are trimmed according to the wind angle and are often not aligned with the boat's centerline, which complicates the direct correlation between sail trim, boat heading, and performance.
The simulations presented herein operate under the assumption that the vessel remains below hull speed, which is the threshold at which the bow wave's wavelength equals the waterline length and significantly increases resistance, acting effectively as a speed barrier. By setting aside the constraints of hull speed, the analysis can directly relate the sail's aerodynamic efficiency, as quantified by the lift-to-drag ratio or equivalently the coefficient of lift-to-drag ratio, to the boat's propulsive force. This simplification acknowledges that in realistic conditions, factors such as the angle the boat is heeling and the drag induced by the hull, keel, and rudder—which vary with sailing conditions—affect the vessel's speed. Introducing the concept of a 'driving force coefficient' based on the premise that the sails are most efficient at the peak lift-to-drag ratio, allows for the decoupling of sail performance from the hull's hydrodynamic behaviors. This assumption is pivotal in enabling the evaluation of sail efficiency across a spectrum of attack angles, facilitating an assessment that reflects the potential driving force without the limitation imposed by the hull's maximum speed.
The constant apparent wind velocity of 12 m/s is another simplification employed in this study. It's a necessary assumption to uncouple the boat's speed from the apparent wind calculation, which is intrinsically linked to true wind speed and boat-induced wind in actual sailing conditions. This assumption means that we do not account for the variation in apparent wind that would arise from changes in the boat's driving force at different headings.
Velocity Made Good (VMG) is a critical concept in sail racing, representing the component of a boat's velocity that is directed towards the chosen course. In practice, competitive sailors aim to optimize VMG to minimize the distance and maximize speed towards the upwind course mark. However, due to our assumption of a constant apparent wind velocity, our study does not explore VMG optimization. This would require a dynamic model where the apparent wind shifts with changes in boat speed and heading, which is beyond the scope of our current simulations.
These simplifications were carefully chosen to keep the study within the realms of a two-dimensional analysis while providing valuable insights into how different sail angles can affect sailing efficiency. The findings should be interpreted with these assumptions in mind, noting that they are indicative of performance trends that would benefit from further investigation under variable wind conditions and in three-dimensional space.
Convergence
Convergence was a critical step in ensuring the accuracy and reliability of the CFD simulation results. Given the complexity of the two-sail geometry, this aspect of the study was approached with particular attention to the mesh's resolution and the simulation's geometric parameters.
To establish a robust mesh, the cell walls were defined as a ratio of the total chord length of the sails, which is 5.28 meters. This allowed for proportional scaling of the mesh to capture the geometry accurately at each step of the convergence process. The initial foresail trim angle of attack was set to 7 degrees, slightly above the minimum angle of 10 degrees for the mainsail, to encompass the operational range of the foresail trims (angle in relation to the mainsail), as suggested by literature, which typically range between 7-20 degrees [11].
The initial meshing attempts faced challenges due to the sails' thin trailing edges. However, through the application of edge sizing and refinement techniques, a mesh that fully captured the curvature of the sails was achieved. Subsequently, the general mesh size, the number of edge divisions, and the level of refinements were systematically varied and their impact on the lift generated by the sails was assessed. This iterative process involved starting with a broad mesh and incrementally increasing the resolution until a balance between computational efficiency and accuracy was found.
Figure 9: Mesh Convergence – Element Size
Figure 10: Mesh Convergence – Number of Divisions
Figure 6: Sail Geometries, Simulation 1 (Top), Simulation 2 (Middle), Simulation 3 (Bottom)
Figure 11: Mesh Convergence – Number of Revisions
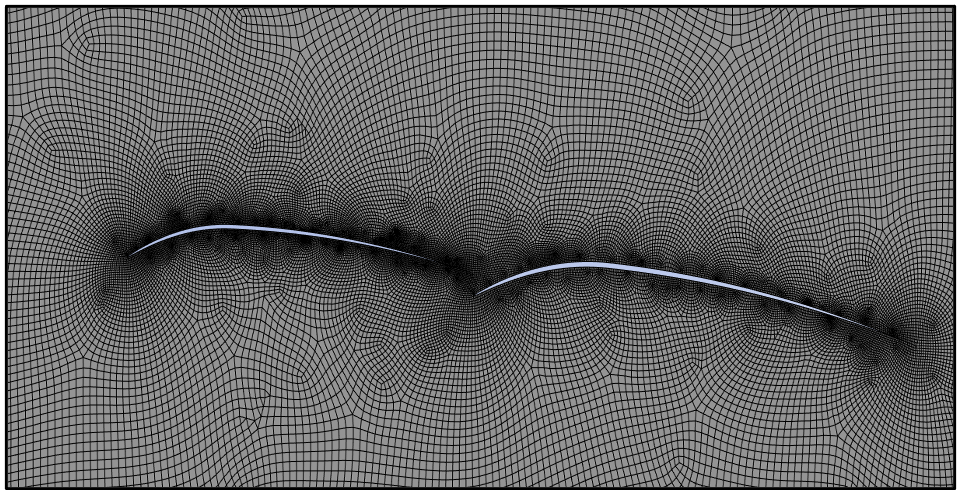
The graphs provided (Figures 9, 10, and 11) illustrate the relationship between element size, number of divisions, and the number of refinements with the total lift generated. The final converged mesh was determined to have an element size of 0.15 meters, 275 divisions, and 2 refinements. The boundary conditions for the simulation domain (Figure 13) were defined to reflect realistic sailing conditions. The inlet, represented by the left wall, was designated as the point of entry for the free stream velocity, simulating the oncoming apparent wind. Conversely, the right wall functioned as the outlet, emulating the air's trajectory following its interaction with the sails. Both the top and bottom walls were treated as slip walls to mimic an infinitely extending stream above and below the sail domain, thereby eliminating any influence these boundaries might exert on the airflow, akin to a mirror reflection.
Figure 12: Converged Mesh
Figure 13: Converged Cell
Figure 14: Geometric Convergence - Cell Height
Figure 13: Geometric Convergence - Cell Length


